
Best Business Intelligence
Our Top 5 Best Business Intelligence Softwares In 2020
Make strategic, actionable insights using your organization’s data to take your business to the next level. These are the best BI tools to help you achieve business success in 2020.

Business Intelligence tools will give you the most effective way to visualize data. This leads to identifying the best decisions and actionable insights to achieve your desired results. These tools are getting more popular because modern businesses are already capable of collecting data from every aspect of the operation.
From sales and marketing, productivity and workflow, hiring, HR, even performance and profit. Unfortunately, a large majority of these useful data remains in isolation. And this is where Business Intelligence tools come in!
Business Intelligence tools will help you connect the dots. These tools are highly capable of not just looking at one facet of your business operation; instead, it ties every key information from every angle to get a better view of your business’s current state.
This is where real insights occur! The insights and predictions provided will help improve your business’ performance. But what’s the best BI tool for your organization? We got the list for you to choose from!
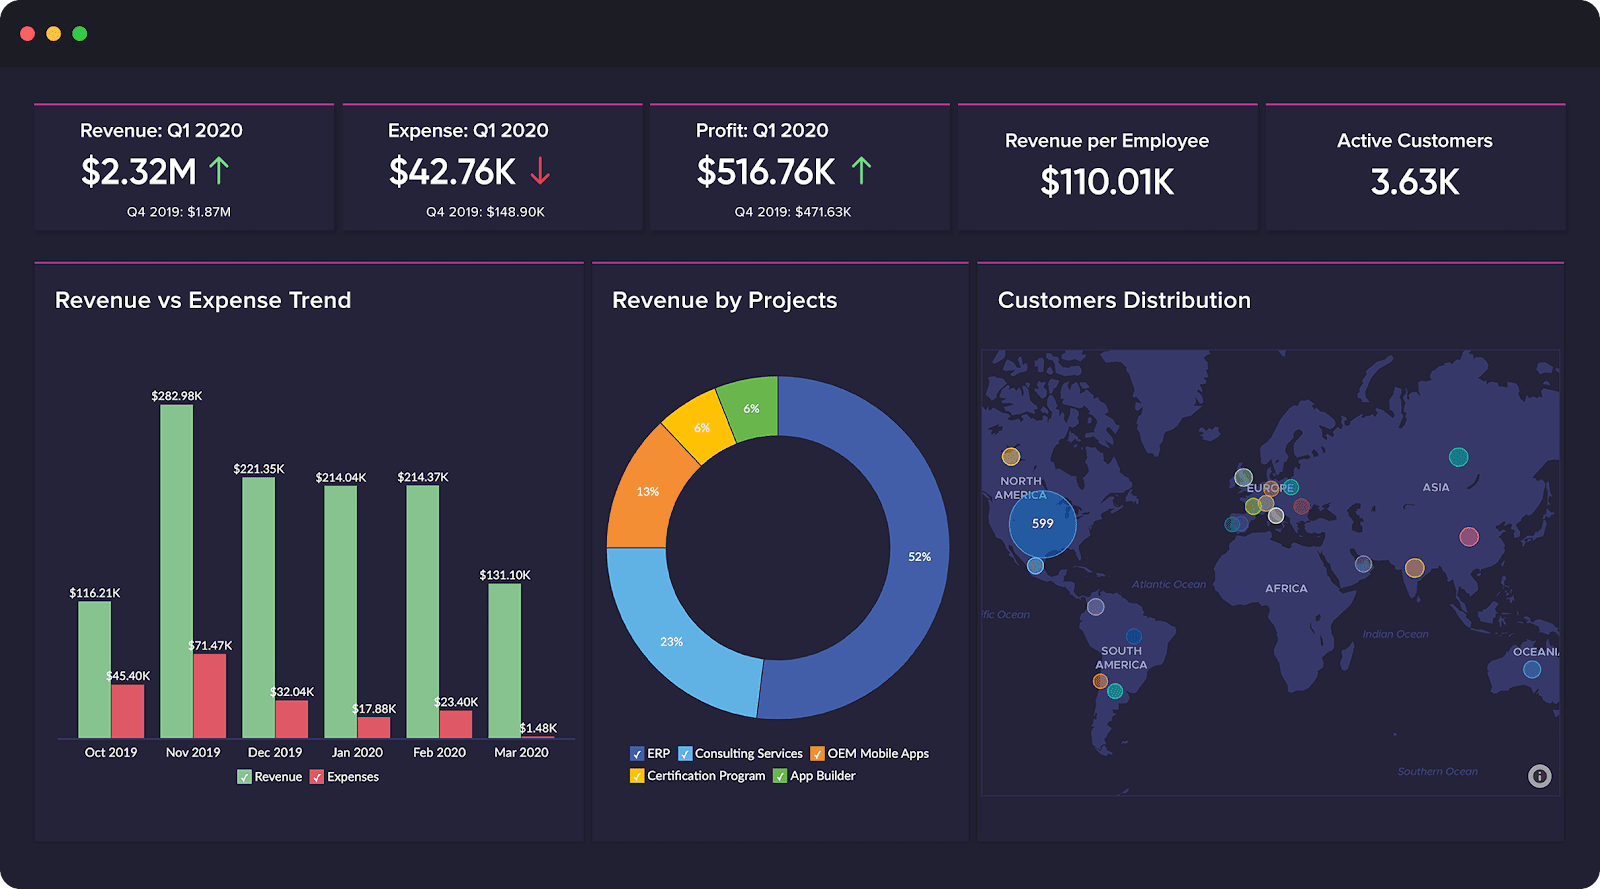
The best business intelligence software must have visualizations you can share with stakeholders. This will aid in communicating complex statistics into understandable charts and diagrams.
This Is Our Top 5 Best Business Intelligence Software in 2020.
Microsoft Power BI
Pros:
- Affordable
- Tier-free
Cons:
- You need to download the software
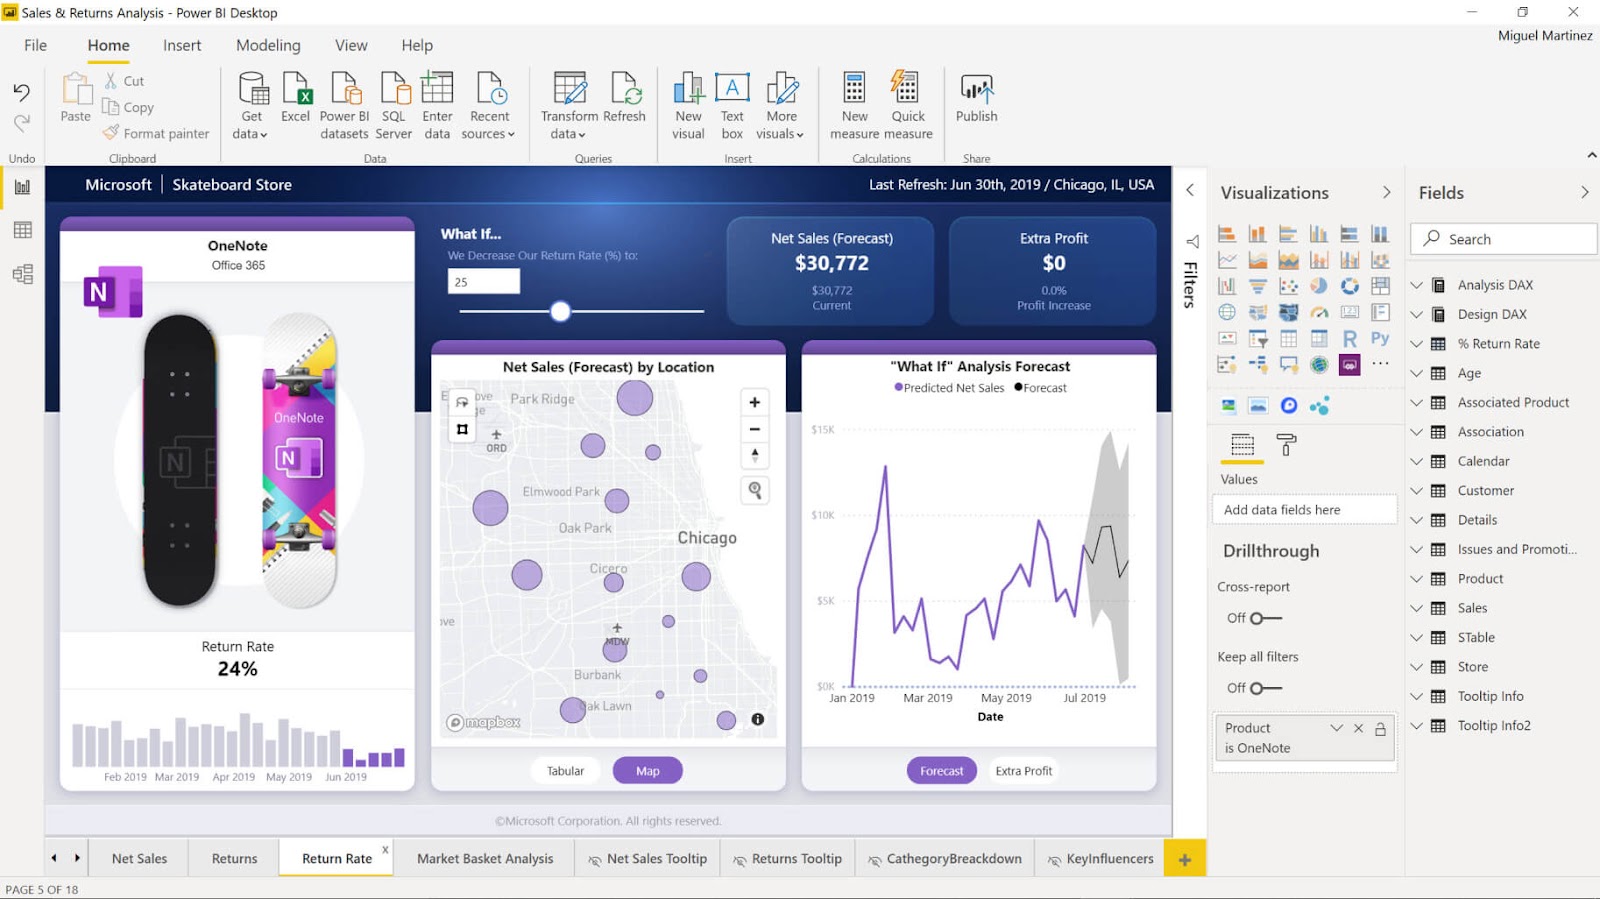
The software giant, Microsoft, has its own Business Intelligence tool called Power BI. In fact, they are conducting the Microsoft Business Application Summit, which features their BI tool along with its other business applications.
Microsoft, however, chose to offer downloadable software instead of web-based applications which is preferred by most of its competitors. With the downloadable software, users can run their analytics via the cloud or a reporting server.
The popular software company is giving away a generous offer of a sixty-day trial. This includes additional Microsoft applications as well as other data sources like Oracle, Sybase, and Facebook.
The prepared data will be discreetly analyzed, which will be transformed into a report in just a matter of minutes.
Tableau Desktop
The premium business intelligence tool
Pros:
- Free trial
- Efficient interface with drag and drop
Cons:
- Expensive
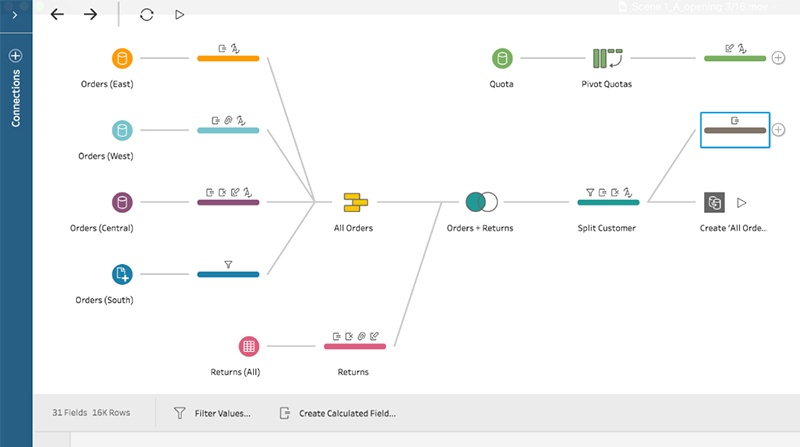
Tableau Desktop strives to do more than make charts. Today, it has become one of the top business intelligence tools with “live visual analytics,” an efficient interface, and drag and drop buttons. This allows the user to spot the trends in real-time.
Moreover, the tool supports a wide range of data sources, including Google Analytics, Box, PDF files, and Microsoft Excel. Tableau is able to connect with almost any database along with a variety of blending choices and a huge selection of charts.
The dashboard visualization is mobile friendly and can be easily shared. Tableau Desktop is expensive if you’re a single user. In fact, it’s more expensive than most of its competitors. It comes with an associated application called the Tableau Prep below the Tableau Creator Package.
Sisense
The business intelligence software used by the big boys
Pros:
- Quick distribution
- AI integration
Cons:
- Shady pricing
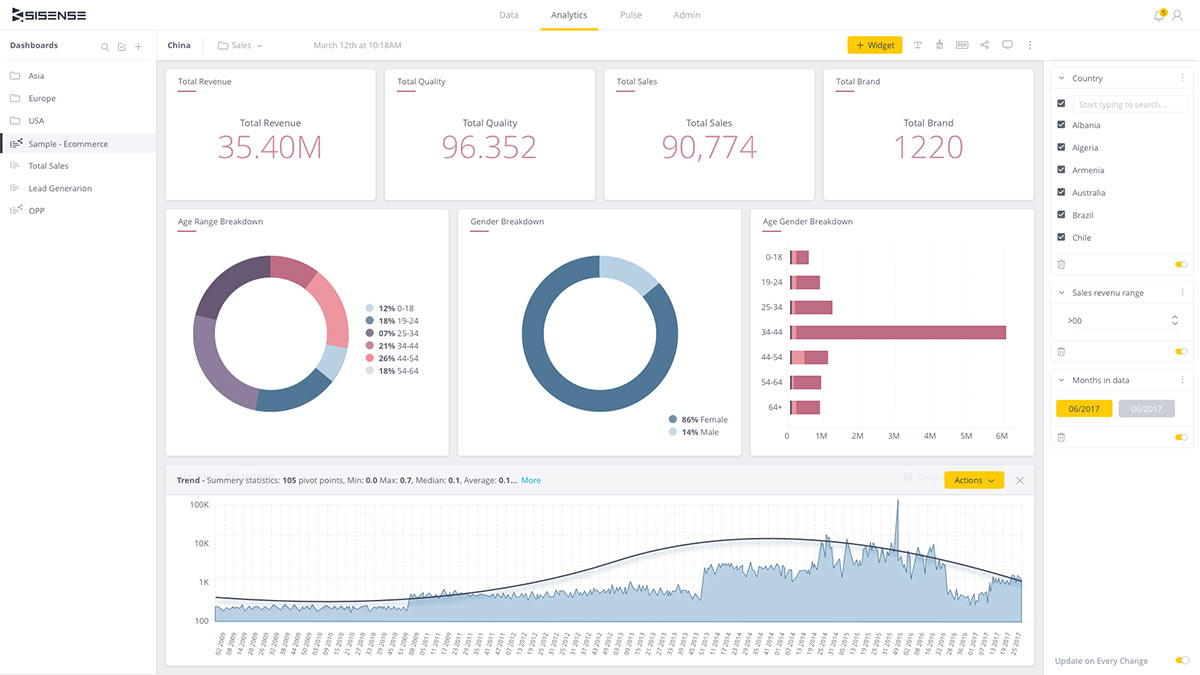
Sisense plays with the big boys, literally! In fact, it’s the BI tool used by Fortune 500 companies. It’s a business intelligence tool that aims to simplify complex operations by incorporating AI and machine learning into the platform.
The tool is streamlined that allows you to go from data to dashboard as quickly as 90 minutes. Furthermore, this software got a big client list such as Philips, GE, Fujitsu, Airbus, and NBC.
Its main feature is capable of merging white label analytics with customization, analyze data across the entire landscape or focus on a specific area, and mash-up live or cached data, object, or system.
Sisense is considered an enterprise-level software that users can run on the cloud or in the office. Unfortunately, Sisense doesn’t offer a flat-rate pricing for all its models. However, you can try to talk to customer service to get a quote.
Dundas
An established business intelligence tool that is very easy to use
Pros:
- Browser-based tool
- Drag and drop
- Generous 45-day free trial
Cons:
- Non-transparent pricing
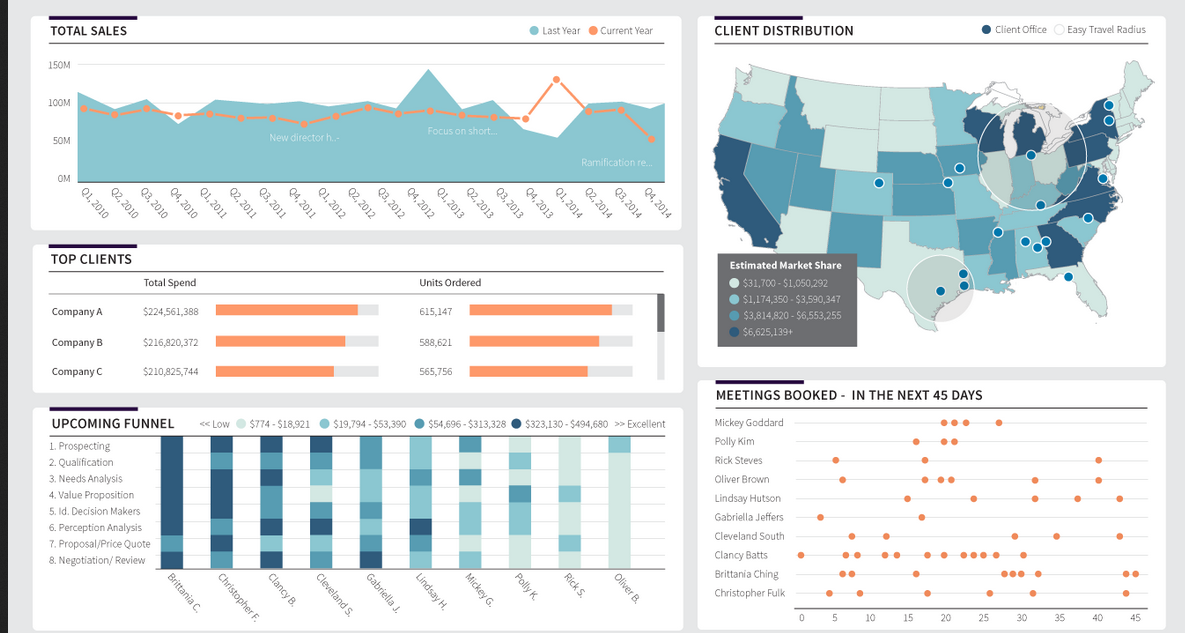
Dundas is an established BI tool with over 25 years of experience in the industry. It’s a browser-based, single tool that is highly capable of transforming data into data analytics. Data can be merged using the drag-and-drop function.
The tool allows users to analyze the data on their own without the help of an IT professional. Moreover, the HTML5 interface grants you access to use the tool across different devices. It also offers a 45-day free trial; however, you need to pay close attention to the pricing because it requires a quote.
Zoho Analytics
The business intelligence software from a group of cloud-based fanatics
Pros:
- Support data collection from different sources
- Slick dashboard
- Free trial available
Cons:
- Requires annual purchase
Zoho Analytics is a product of the esteemed Zoho Office. The company has a wealth of experience with web-based business tools. With that said, you can expect that this BI tool is as robust as it can be made.
For example, its Zoho Reports is a dependable solution that is capable of integrating data from different files. This includes files from Microsoft Office documents, MySQL, URL feeds, Zoho applications, and even external sources like Google Drive, Box, and Dropbox.
It also supports other applications like Quickbooks, Salesforce, and Google Analytics. It’s a very competent tool that can mix data through statistical and mathematical formulas like marketing costs in Excel spreadsheets. The sales data is then transformed into an engaging report.
All these processes are done through a simple, easy-to-use online interface and a drag and drop operation. The created reports can be easily viewed through email, print, or portal.


Samsung Is Giving Away $700 Off On Its Galaxy S21 Deal

Why You Need To Buy Apple’s New iMac and iPad Pro 2021 Right Now

HP Z27k G3 4K USB-C Display 2021 Review

Top 10 Questions About Norton

LPGuard’s Best Monitors Under $200 In 2021
